Ever since 2007, #MeToo has been trending on social media, especially after the Weinstein gate in 2017. Since then, the debate around inequalities between men and women has been a burning subject. Organized sexual exploitation of young women, like the gate of Jeffrey Epstein, inequalities, trivialized sexism, sexual harassment, consent, all have been on the headline of the journals and have triggered massive demonstrations all over the world. And the media are not innocent in this social discrimination. Indeed, according to research pursued by the UNWomen over more than 100 countries, sexism in the media nowadays is striking. In terms of managing positions, men still represent 73% of the top media management positions, according to another study gathering 522 news media organizations. Moreover, about 46% of news stories spread gender stereotypes and only 6% promote gender equality.
Our goal:
In our analysis, we want to see whether the feminist movements from the last years had any significant impact on the representation of women in the media.
In other words, are women more represented nowadays than before 2015, are they represented in all the fields at the same level of men and is there still a discrimination based on age against women?
Inequal representation in the media in terms of coverage
"The media reflects what the people say, the people reflect what the media says. Will we never tire of this mind-numbing game of mirrors?"
- Amin Maalouf
According to Amin Maalouf, if the attitude of the people has changes towards women, it must be felt in the medias. We are then going to observe the women representation in the media over the time, starting with the quote distribution over men and women.
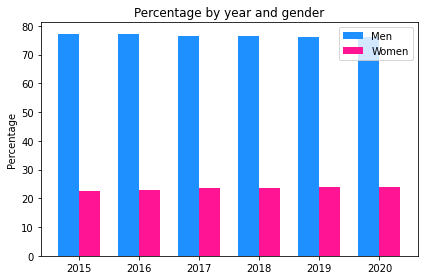
Which percentage of the quotes are women's and which percentage are men's?
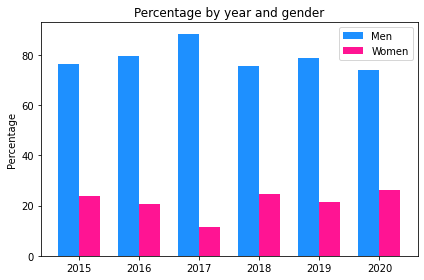
With a simple look of the data, we can see very clearly that even though feminist events have occurred, the difference in terms of repartition of the representation is still huge. Indeed, in our timelapse, the repartition of occurrences of speak between women and men stays on a base of 20% against 80%. However, the one-sided proportion z-test between 2015 and 2020 (p-value = 4.814710546166949e-96) seems to indicate that there is indeed an increase in the coverage of the women over the five years of our dataset.
But how is this difference in terms of number of occurrences between men and women explained? Does this mean that each man is on average more quoted than women or more men are quoted?
How many quotations per individual?
Major part of the population
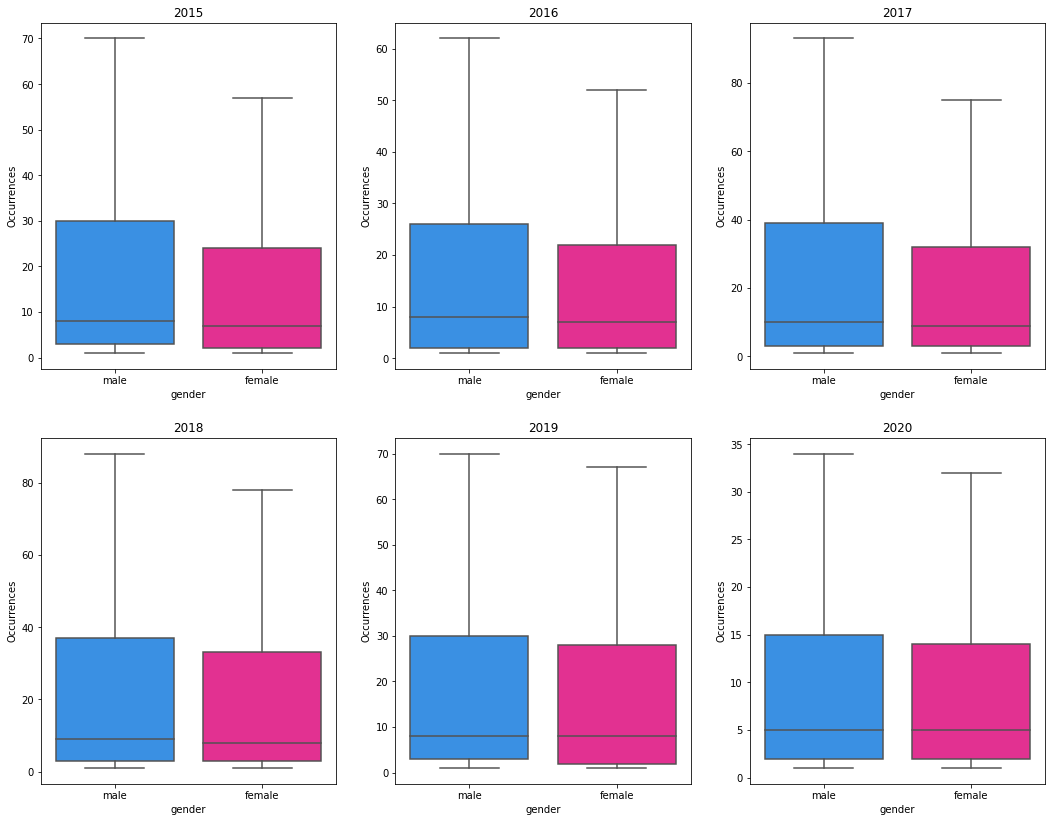
Our graph doesn't show a strict difference between the median of the number of quotations per men and per women. However, the results of our one-sided Welch's t-test on the mean seem to say that there is a difference in occurrences between men and women in our data (before performing the t-test, we removed the outliers of the data by using the z-score criterion) :
| Year | Statistic | Pvalue | 2015 | 19.569733843712896 | 1.8691937970370853e-85 |
|---|---|---|
| 2016 | 9.024466513426889 | 9.210044610668905e-20 | 2017 | 22.425390108058973 | 1.6051051507580176e-111 |
| 2018 | 21.09033178067998 | 6.335574661837446e-99 | 2019 | 9.94078438864509 | 1.410909288072331e-23 |
| 2020 | 7.716828059587249 | 6.048150213898528e-15 |
We can conclude from our results that, on average, a man is more often quoted than a woman.
100 more represented speakers
| Year | 2015 | 2016 | 2017 | 2018 | 2019 | 2020 | Number women | 12 | 11 | 15 | 17 | 19 | 18 |
|---|---|---|---|---|---|---|
| Number men | 88 | 89 | 85 | 83 | 81 | 82 | Proportion of women occurrences | 11% | 14% | 14% | 13% | 17% | 14% |
The number of women in the top 100 most quoted persons in our dataset doesn't seem to increase a lot over the last five years.
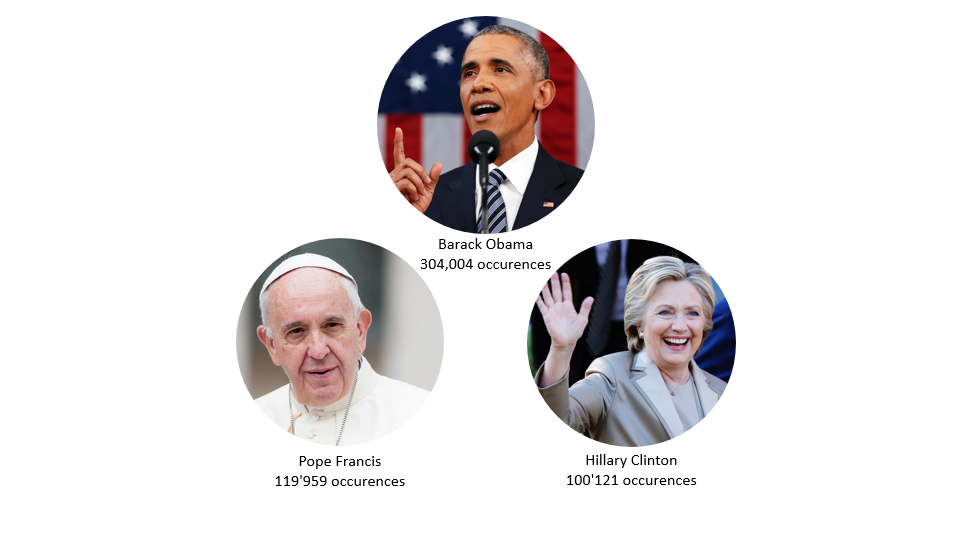
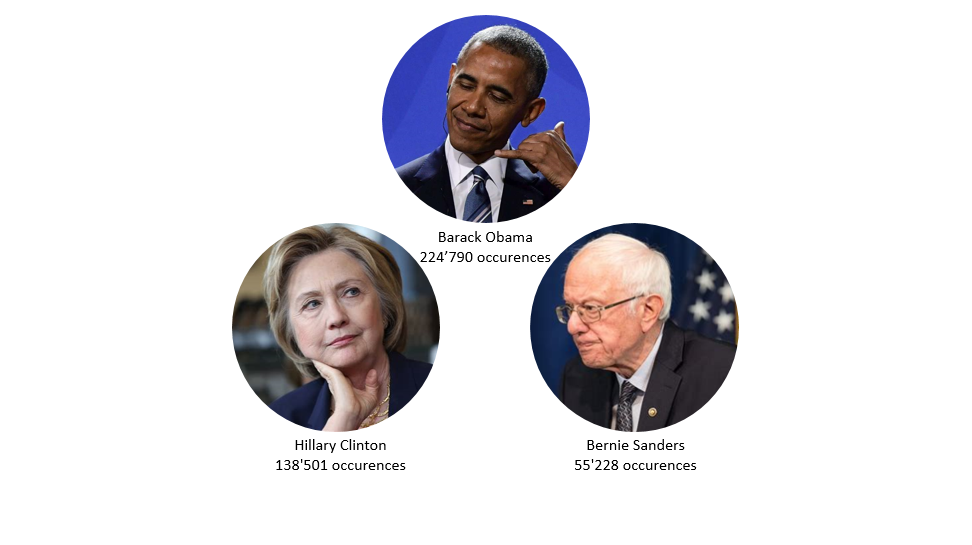
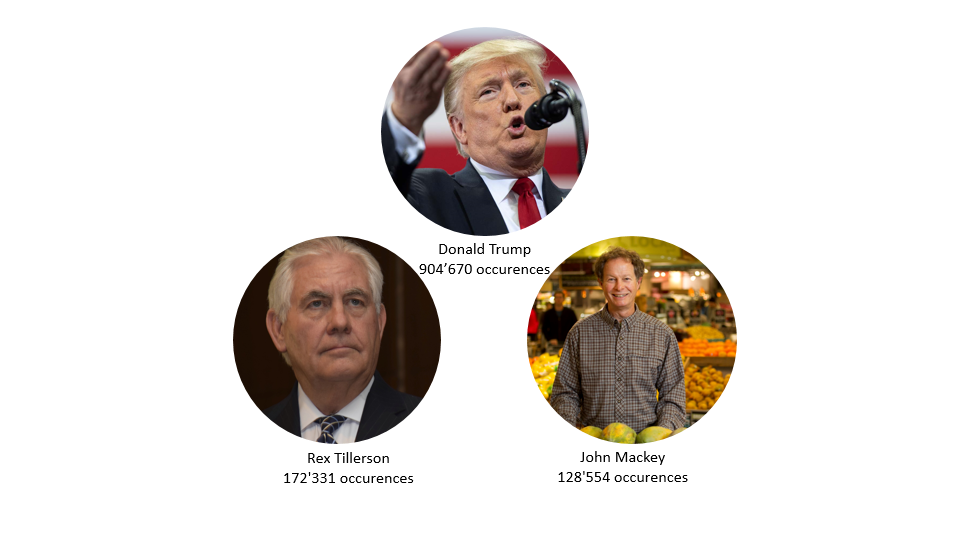
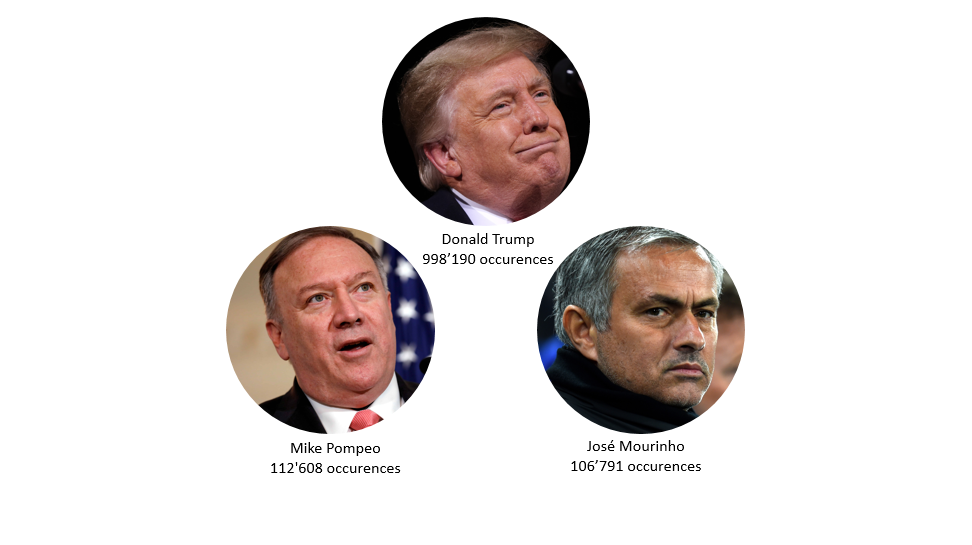
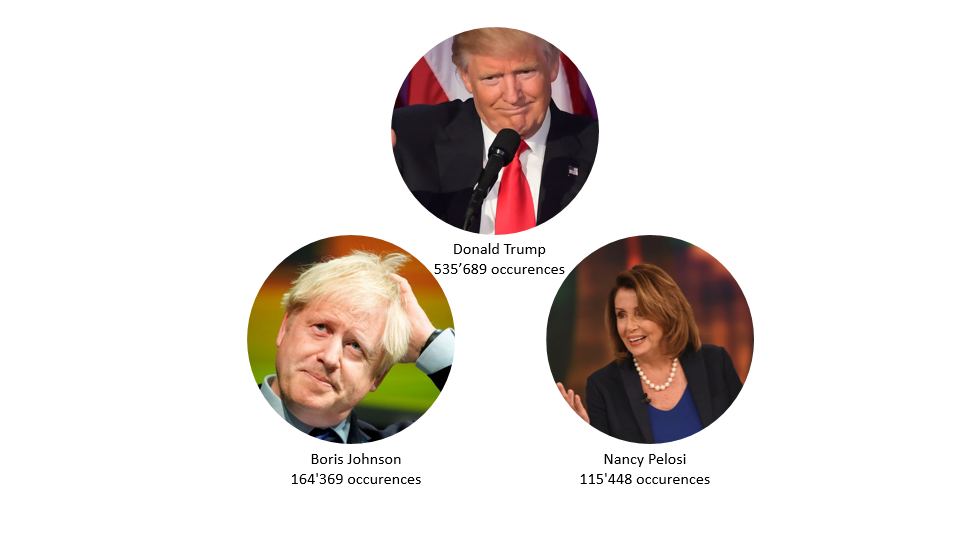
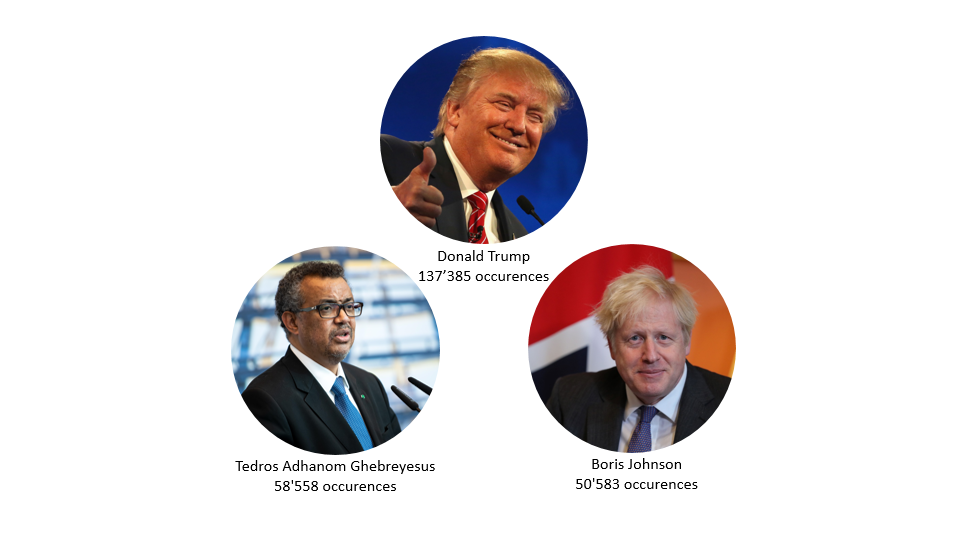
Among the top 3 most quoted people in our dataset over the years, only two of them are women, Hillary Clinton and Nancy Pelosi. They are both politicians. On the other hand, in this top 3, some of the men are company directors. We even find a football trainer. Which leads to the question: are men and women equally quoted on all topics or is there a gender-based discrimination on the topics?
How many different men are quoted in the dataset?
According to our graph, men represent 80% of the quoted person whereas women represent only 20%. This repartition doesn't change over time. We can conclude that the difference in terms of number of men against women could be the key to explain the first graph we obtained.
Are these people different in terms of age?
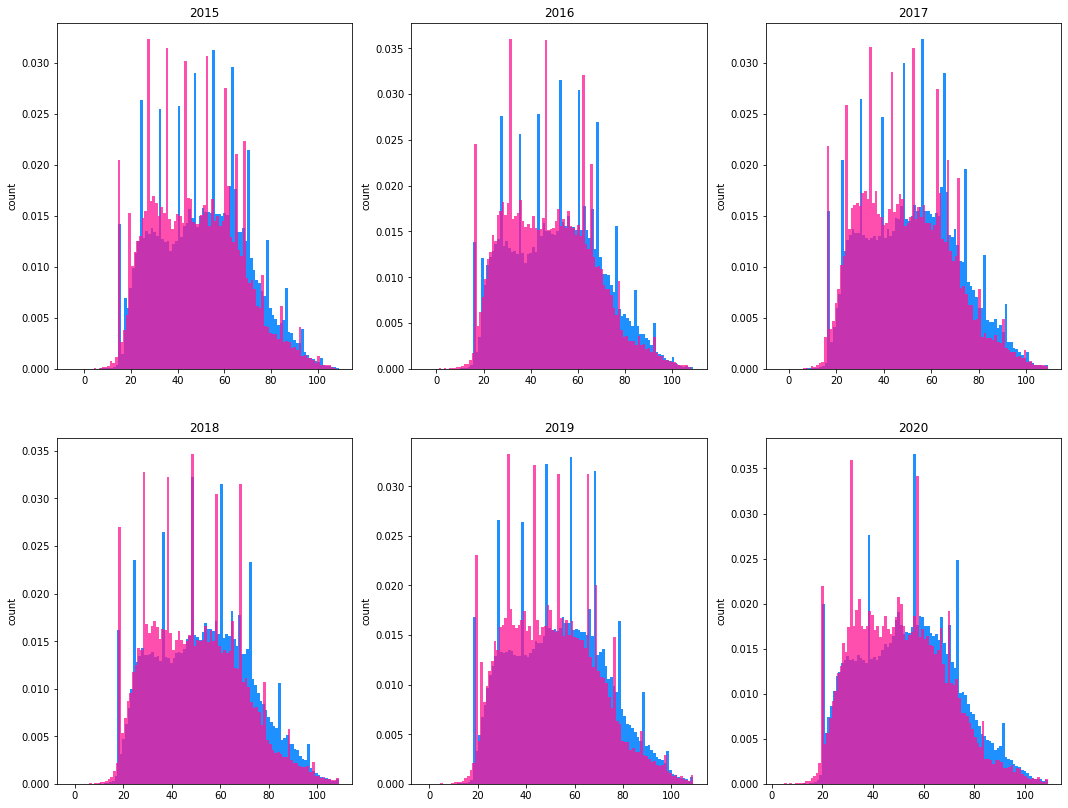
According to our graph, in terms of percentage, women are more represented when they are young than when they are old, and it is kind of the opposite for men. The one-sided t-test (p-value = 3,15e-46) proves that there is a statistically significant difference between the mean of the age of alive men and women.
The curious thing about the dead people that are quoted is that the repartition men /women is close to the same as today, the men are quoted approximately three to four times more than women!
Conclusion
Our graphs and tests seem to indicate that women are less quoted in the media, and when a woman is quoted, she is on average less quoted than a man. Moreover, even though we have a statistically significant augmentation in the proportion of occurrences of women in our dataset, this augmentation is really small. We can then conclude that even though many feminist events have occurred in the last five years, we don't clearly see the effect of these events now. Indeed, women are still in a state of withdrawal compared to men. They are less present on the public scene, and when they are, the media coverage is smaller. But maybe it will happen with a delay?
Inequal representation in the media in terms of profession
- Sports: athletes
- Arts: painter, musicians, compositors, writers, actors, models...
- Politics: minister, president, head of government...
- Science and technology: physicien, computer scientists, health professional, researcher, engineer, technician...
- Religion: clergy...
- Armed forces: soldiers...
- Civil service: diplomat, public employee, activist...
- Legal professionals: jurist, lawyers...
- Manual work: artisan...
- Education & studies: teacher, academic professional...
- Business: entrepreneur, manager, executive...
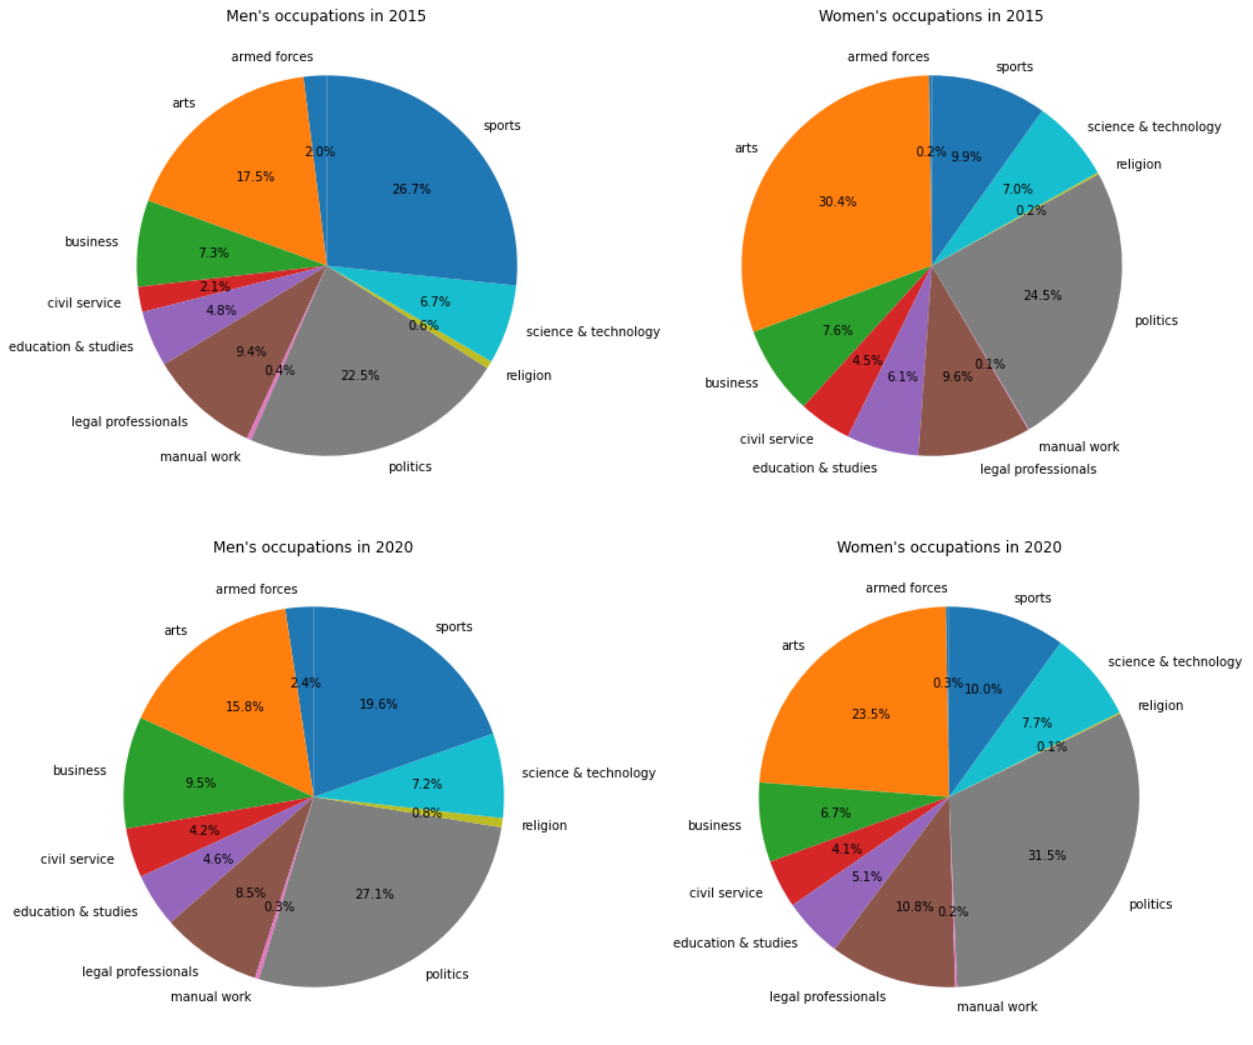
According to our graph, the three most represented occupation fields are sports, arts and politics. In 2015, most of the quoted women work in the field of:
- Arts
- Politics
- Sports
- Sports
- Politics
- Arts
Between 2015 and 2020, the proportion of quoted women in politics has increased, and the same proportion in arts has decreased. The same pattern can be observed for men, the proportion of men in politics increases, whereas the proportion in sports decreases.
- Because of COVID, sport and art events have been canceled, so the mediatic coverage focus on someting else, like, for example the pandemic or the management of the crisis
- The election of the new president was taking place
Women in sport:
According to the Olympic CIO report on Tokyo2021 , men and women are equally represented. Women represent 49% of the athletes against 34% in 1996. Moreover, in 2016, more than half of the american team was feminine. We could then conclude that media chooses to represent more regularly men than women.
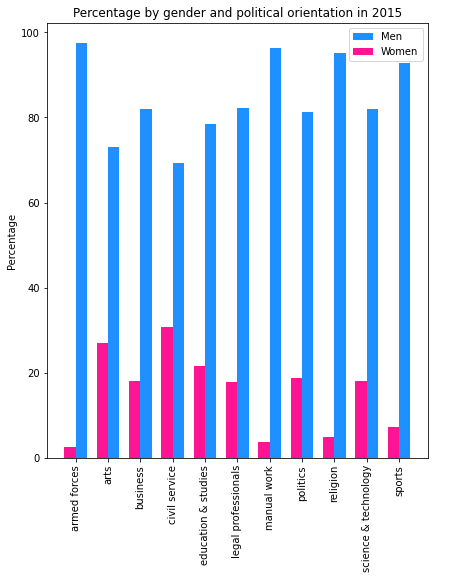
On this graph we can see that on the topics that are more traditionally reserved to men, like the army, sciences or manual work, men represent the great majority, whereas on topics like arts, civil service or education, women are more represented. Either women are less represented in the army or manual work field (the dataset doesn't give us any information about that) or there is a gender-based discrimination.
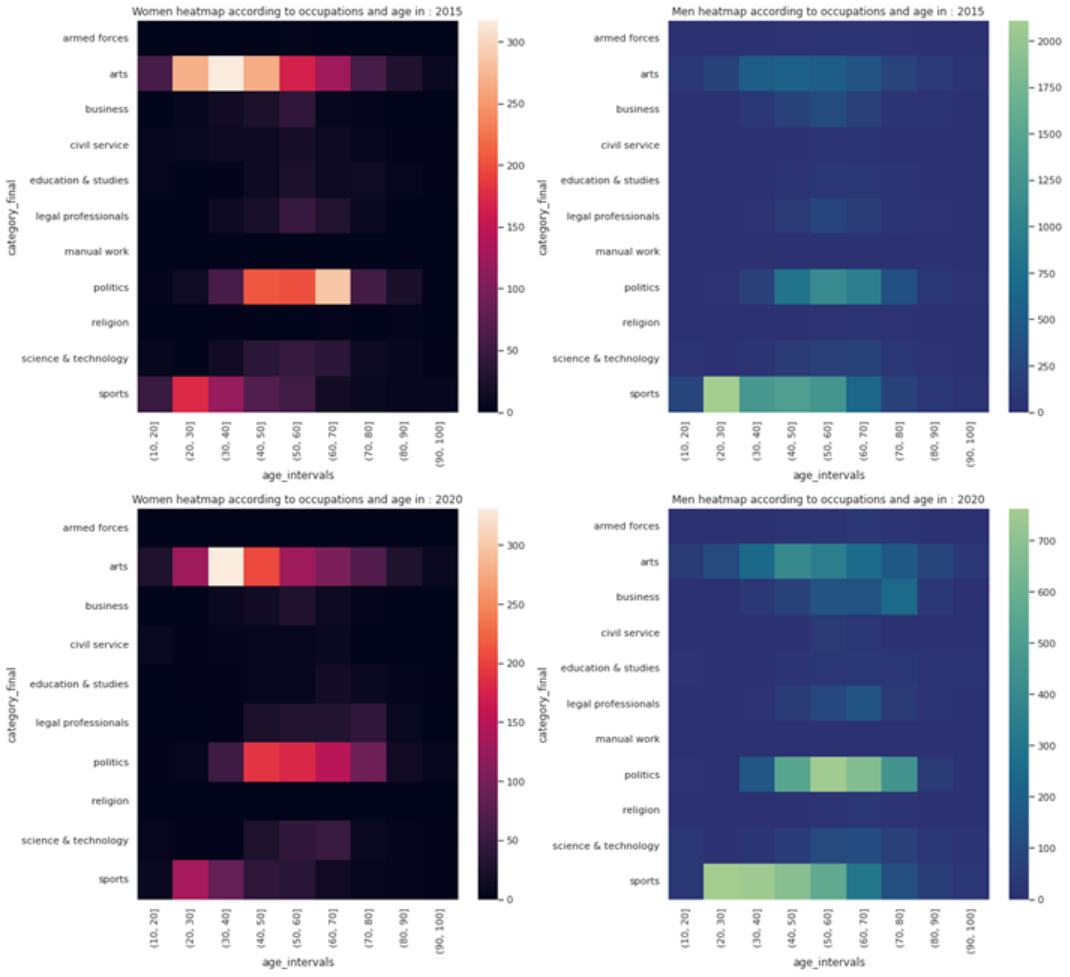
Then, we made heat-maps to visualise the occupations according to the age for women and men. On these graphs, the brighter it is, the more speakers there are. Therefore, as we can see on women's graphs, there is a lighter area for younger artistic women and for older political women. On men's graphs, we can see a light area on younger sportive men and on older political men. These findings confirm the results that we got previously, i.e. the top 3 occupations for men and women and the age distributions.
As a conclusion, we can say that :
- Younger women are more quoted that older women
- Women in arts and politics are more represented than women in other occupation fields.
- Older men are more represented, most of them are politicians.
Inequal representation in the media in terms of political orientation
"No one respects women more than I do."
- Donald Trump
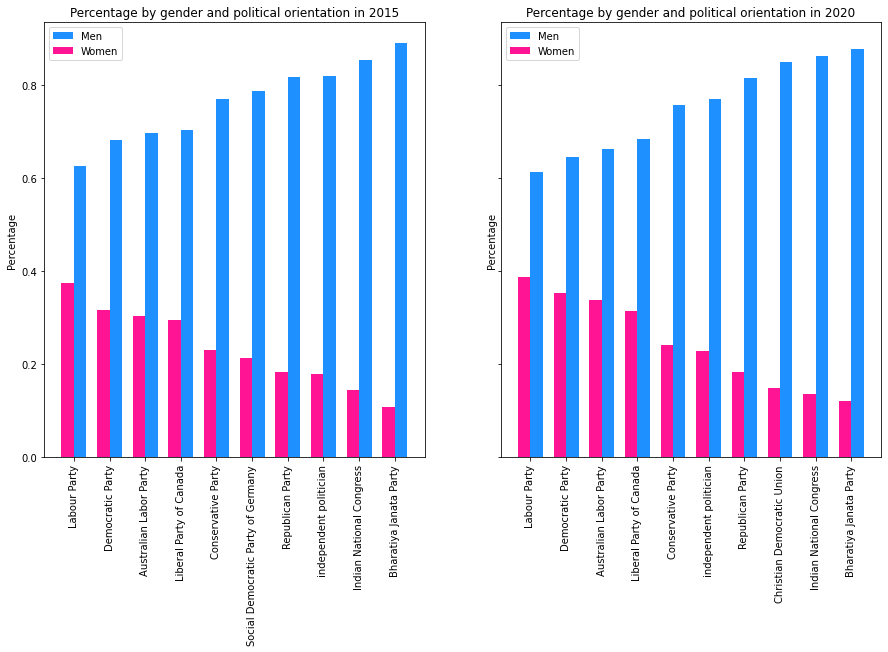
Indeed, after finding this quote from Donald Trump, we asked ourselves if the political orientation of the speakers correlates with women's representation in the media. Therefore, we sorted all the existing parties in our data set by the women's percentage, starting with the party with the biggest women proportion. Thus, we can see on these graphs the "10 best parties" according to women's proportion. We can see that the parties that have the most women among their members are mostly democratic and social parties opposed to the conservative and republican parties, that contain the least women. Therefore, we can see a link between the political orientation and women's representation.
Emotionnal context of the quotes
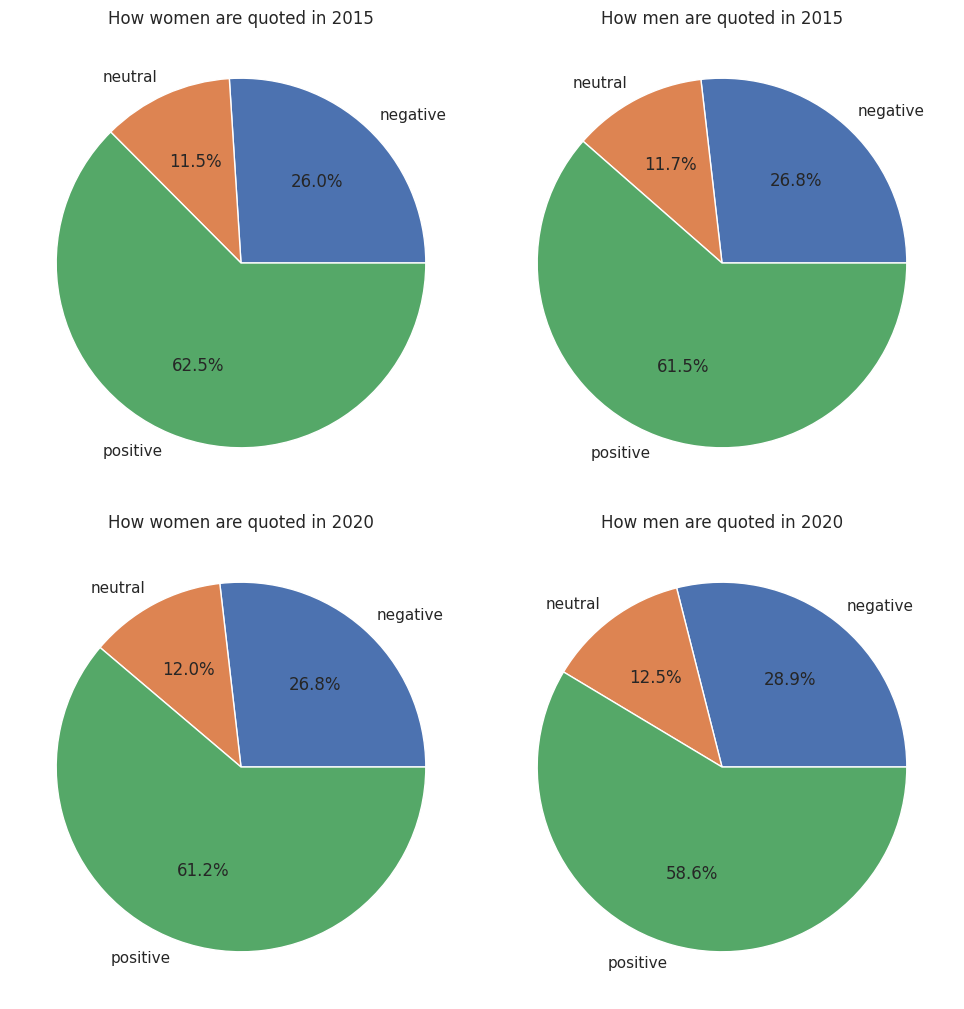
We want to find here the sentiment with which a person is quoted, or the feeling that the author of the article gives when citing a person. Thus, we use VADER, a lexicon and rule-based sentiment analysis tool capable of classifying text in three sentiment categories: a negative, a neutral and a positive one. The following pie graphics show that throughout the years, the sentiment of the context in which people are quoted in the media stays the same. Around 60 % of the quotes are cited in a positive way, 25% in a negative way, and 15% in a neutral way. Furthermore, these percentages of sentimental contexts are globally the same for women and men. Finally, we can conclude that it seems that women are not quoted more or less negatively or positively than men. Thus, it may not play an important role in women's representation in the media
Final Conclusion
Despite the #Metoo movements these past few years, we cannot see a real improvement in women’s representation in the media. Men are much more represented in terms of occurrences, whatever their work, their occupations, their political orientations, or their age. There are still some improvements over the years though, as the proportions of quoted women slowly increased. However, women and men seem to be equally quoted, as the feelings they convey are in the same proportions. One thing that could explain these results is that people take a lot of time to change their minds, as the effects of feminist and progressive movements are slow. It is also the accumulation of these movements that make a clear improvement in women’s condition, the #Metoo movements are too recent.